Power BI Consultant / AI Strategist
United Kingdom

Session Abstract
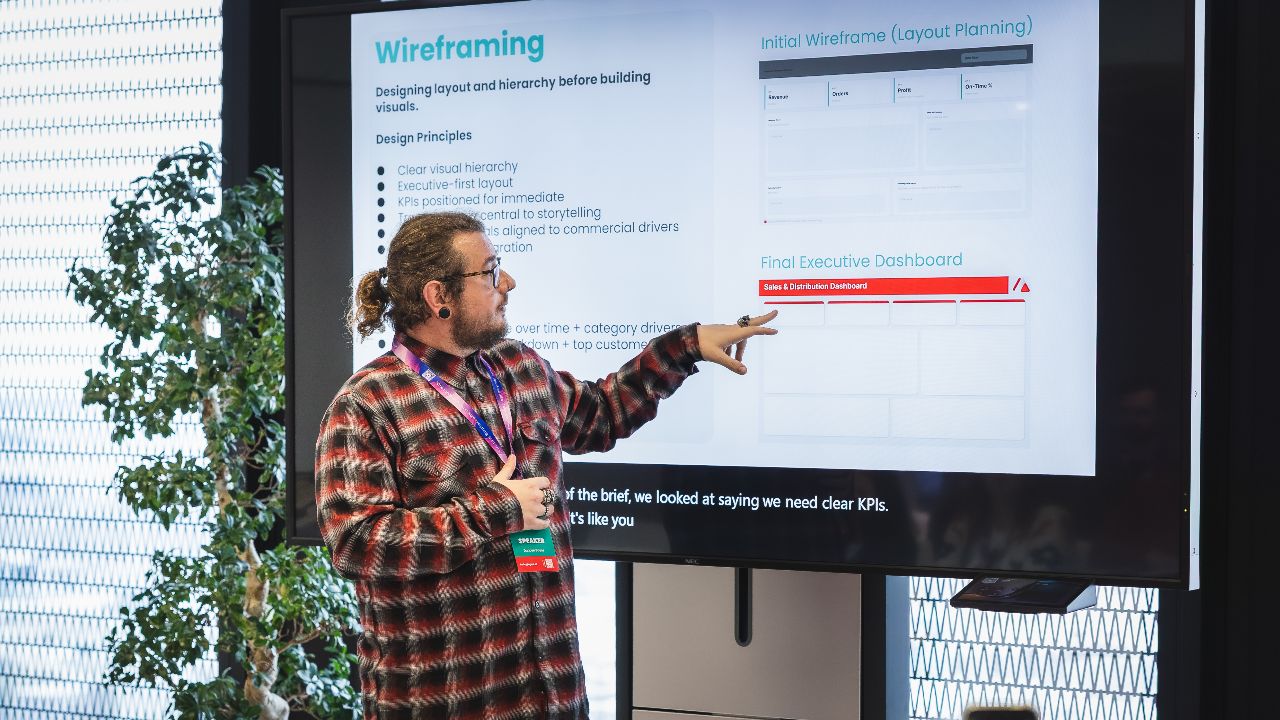
You've seen the demos. One model, one chart, everything works first time. Real builds don't go like that, and a room full of developers knows it. So I built a complete three-page Power BI report through AI, end to end, without opening Desktop until the final check. This session is the honest account of how. We'll walk the full pipeline across the three layers most AI content skips: The model: tables, relationships, and measures, built by conversation through the Power BI modelling MCP. The design: the step nobody covers, wireframing the report in Figma first so it looks designed, not assembled. The report: pages, visuals, bindings, and theme generated through pbi-cli. Then the part that earns your trust: the twelve things that broke, and the fifteen-second fixes for each. You'll leave with the real workflow, not the demo. Three takeaways: The three-layer pipeline for building a Power BI report with AI, including the design layer almost nobody talks about. The specific gotchas that break a Desktop-free build, and how to fix each one fast. A clear sense of which parts of the pipeline are ready today and which still need your hands.
Duncan Boyne
I’m a Power BI and Power Platform consultant with a background in turning messy, real-world data into something people actually want to use. I spend most of my time working with Power BI, Dataverse, Power Apps, and Power Automate, helping organisations move from “we have data” to “we trust our data”. I’m particularly interested in report design, semantic models, governance, and making complex concepts feel simple. Outside of client work, I’m heavily involved in the Power Platform community. I run the Norfolk Power Platform User Group, help organise regional events, and regularly speak at user groups and conferences across the UK. My sessions are practical, honest, and based on lessons learned the hard way, with a focus on things you can apply the next day.
Duncan can deliver sessions in
Duncan speaks about
Relevant industries
Connect with Duncan