Edin Kapic
Vista
Lead Engineer
Spain
Upcoming Speaking Engagements
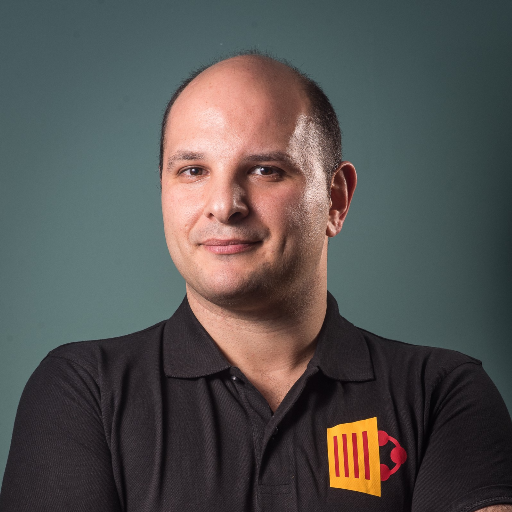
Edin Kapic is a Lead Software Engineer working for Vista in Barcelona (Catalonia). SharePoint MVP since 2013, he is also a co-founder and president of the Catalan SharePoint User Group (SUG.CAT). He also writes and speaks about SharePoint in numerous publications and events. When he has some free time, he enjoys sailing and reading. He is a hardcore development guy but he also enjoys bridging the gap between business and technology. One of his initiatives is to empower technical people in the soft skills that are extremely valuable but seldom taught.

Meet Edin next at
Adriatic Tech Summit 2027
05/04/2027
Airbus or Boeing? Flying .NET on Azure and AWS
Adriatic Tech Summit 2027
development
platform
05/04/2027
Congress Center Hotel Hills
Ilidža, Bosnia and Herzegovina
Same service, two clouds: OpenTelemetry observability for .NET and Node backends on Azure and AWS
ECS 2027
cloud
observability
31/05/2027
Congress Center Düsseldorf
Düsseldorf, Germany
Edin can deliver sessions in
English
Spanish
Portuguese
Bosnian
Catalan
Valencian
Croatian
Serbian
Edin speaks about
aviation
author
languages
Relevant industries
Computer Software
Connect with Edin